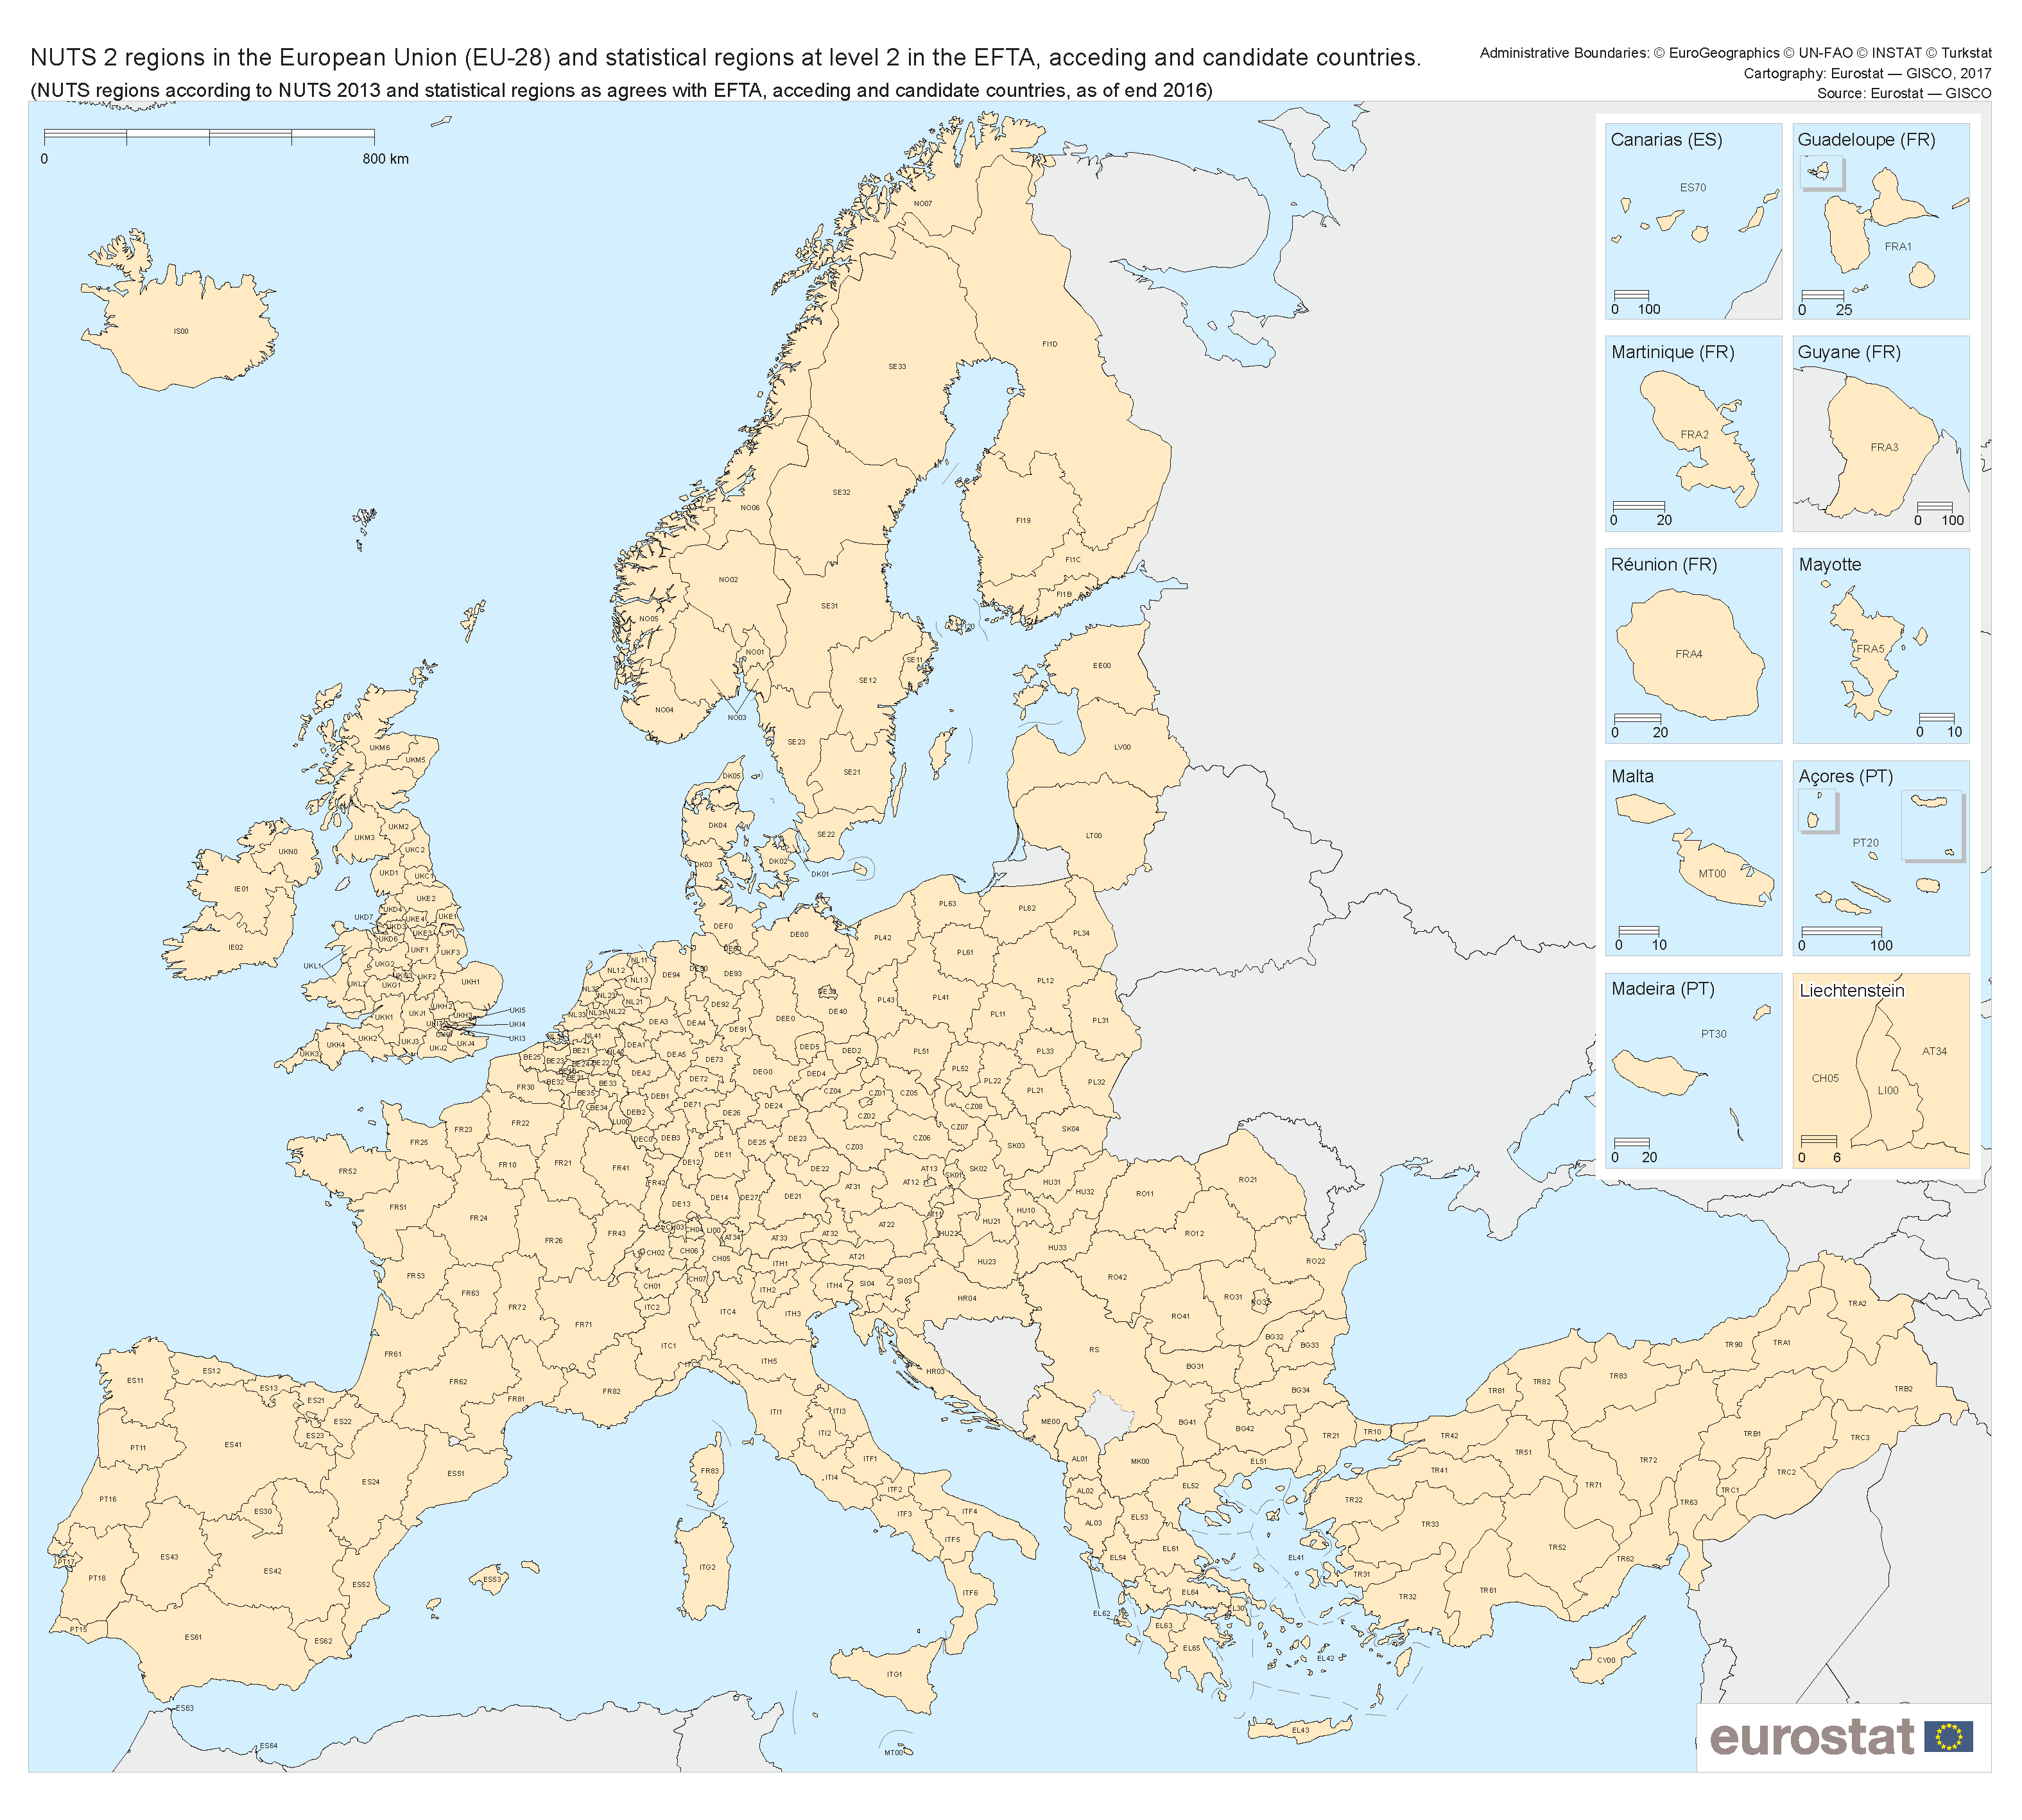
We are pleased to announce a new dataset for download. We have simulated Europe’s fleet of wind and PV plants and aggregated it to NUTS-2 regions. This gives more granular detail than our existing national dataset, splitting 29 countries in Europe into 281 regions as pictured here:
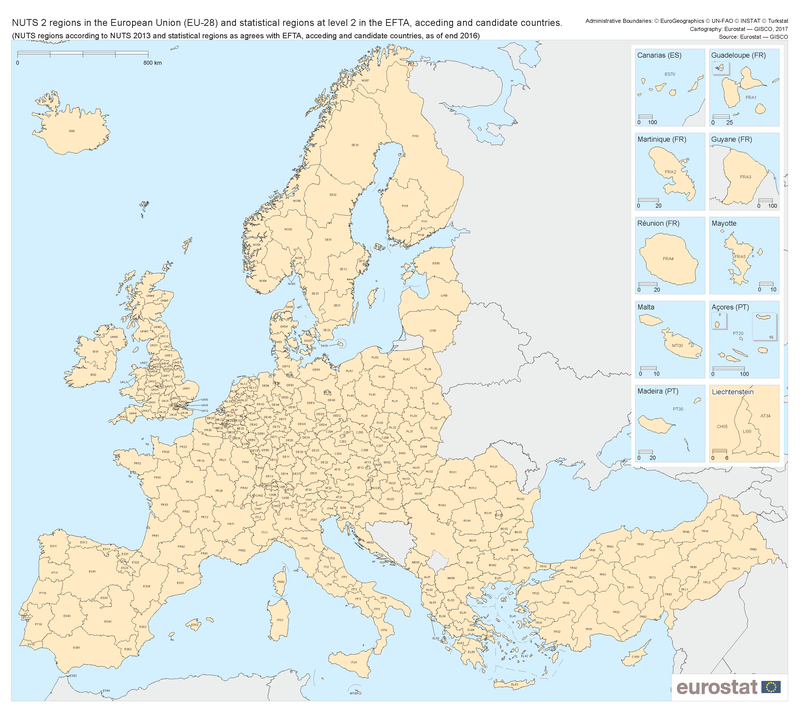
(Image source and full-resolution version: Eurostat)
We have also produced maps of the NUTS zones in each individual country (NUTS2 Ninja Simulation Maps, PDF, 7 MB), showing where the individual wind farms and PV plants were located.
This data is available through the country interface. Select a country of your choice, and you can now access the NUTS-2 downloads alongside the existing national data.
For PV, we have calculated the NUTS profiles using the CM-SAF SARAH satellite dataset. For wind farms, we use the NASA MERRA-2 reanalysis wind speed data, with both onshore and offshore farms included. Offshore farms were attached to the closest NUTS region. With both simulations, we used the installed wind fleet as of the end of 2017.
This dataset is comparable to the JRC EMHIRES I (wind) and EMHIRES II (solar) datasets.
We developed the dataset at the request of researchers from RWTH Aachen in Germany, who recently published a paper, Comparison of long-term wind and photovoltaic power capacity factor datasets with open-license. Their peer-reviewed paper provides the first independent comparison of the Renewables.ninja and EMHIRES datasets against measured network operator data. For example, they find that the Renewables.ninja dataset represents the extreme high and low wind speeds to an accuracy of 0.2%, versus 7.5% for EMHIRES I:
Table: Mean shares in % that the richest and leanest hours represent in the yearly wind energy yield for all countries and years here observed
| Richest hours | Leanest hours | |||||
|---|---|---|---|---|---|---|
| 2000hs | 1500hs | 1000hs | 2000hs | 1500hs | 1000hs | |
| Ninja 1.0 | 49.5 | 40.6 | 30.0 | 5.7 | 3.6 | 2.0 |
| Ninja 1.1 | 48.8 | 39.9 | 29.6 | 5.7 | 3.6 | 1.9 |
| Ninja 1.1 On | 49.6 | 40.8 | 30.3 | 5.5 | 3.5 | 1.9 |
| EMHIRES | 57.3 | 47.6 | 35.5 | 2.7 | 1.5 | 0.7 |
| TSOs | 49.8 | 40.8 | 30.3 | 5.3 | 3.3 | 1.8 |
Source:
L. Moraes, C. Bussar, P. Stoecker, K. Jacqué, M. Chang and D.U. Sauer, 2018. Comparison of long-term wind and photovoltaic power capacity factor datasets with open-license. Applied Energy, 225, 209-220. DOI: 10.1016/j.apenergy.2018.04.109